Wind Turbine Aerodynamics - Lecture
18 May 2026, Pascal Weihing
Airfoil Aerodynamics and Their Relevance at Turbine Manufacturers
Wind turbinrd are becoming ever larger because with larger rotor area, momre energy can be harvested from the wind and at greater hub heights above the ground, there is more wind.
With larger wind turbines, the cost of energy can be reduced
Levelized cost of Energy (LCOE) is a metric to assess the cost of electricity generation and the total power-plant-level impact from technology design changes, should be as low as possible
$$ LCOE = \frac{CapEx \cdot FCR + OpEx}{AEP / 1000} $$
- $CapEx$: capital expenditures [$ / kW]
- $FCR$: fixed charge ratio [%]
- $OpEx$: operational expenditure [$ / kW / year]
- $AEP$: annual energy production per year [MWh / MW / year]
Flow around the Airfoil
How can aerodynamics help to decrease the LCOE?
- By lowering the $CapEX$ of the turbine, which makes the components cheaper
- Reducing the weight of the blade
- Finding ways to simplify the blade geometry and maintaining the same aerodynamic properties
- By saving costs during logistics and installation
- Risk assessment and potimization of blade transportation
- Guidelines to define limiting wind speeds for listing blades or the generator
- Prevention of vortex induced tower vibrations during the building process
- By lowering the $OpEx$ of the turbine, making it more durable and easier to maintain
- Reduce leading edge erosion
- Design components that last the entire lifetime of the turbine
- By boosting $AEP$, increasing the power output
- High performance airfoils
- Precise knowledge of the aerodynamic optimum and the limits to define high yield operation modes
- Blade optimizations with add-ons (vortex generators, spoilers, trailing edge serrations)
Basic Definitions
- suction side / pressure side instead of upper and lower side
- trailing edge: most downstream position on the airfoil
- leading edge: point of the largest distance from the trailing edge point
- chord: connechting line between leading edge and trailing edge points
- thickness distribution: defined by the diameters of the circles fitting into the airfoil contour
- maximum thickness: diameter of the largest of these circles
- leading edge radius: radius of the smallest circle fitting the leading edge
- relative thickness: maximum thickness divided by the length of the chord
- chamber line: connecting line of all mid points of the circles
- chamber: maximum distance of the chamber line to the chord
How to Measure Lift in a Wind Tunnel
- Integration of the pressure distribution on the airfoil
- Lift component is normal to the airfoil
- Sectionwise information on lift
- Needs instrumentation on the wing
- Local flow phenomena can be detected (separation, transition)
- Pressure integration along the wind tunnel walls
- No instrumentation required on the wing
- Lift of the entire model measured
- Correction fot limited integration length needed (Wind tunnel section too short)
- Force balance on the model mounting
- Measurement of forces and moments possible
- Measurement by strain gauges
- Typically used for full configurations airplanes, cars, helicopters, ...
How to Measure Drag in a Wind Tunnel
- Integration of the pressure distriution on the airfoil
- Pressure drag only
- Pressure drag component is parallel to the inflow
- Good approximation of total drag in stalled operation and for flatback airfoil
- Wake rake measurement measures velocity deficit in the wake
- State-of-the-art airfoil measurement for total drag (pressure + friction)
- integration of velocity deficit downstream of the airfoil
- Cannot be used in massive separation or together with acoustic tests
- Force balance on the model mounting
- Takes total drag of the model into account
- Measured by strain gauges
- May be less accurate for small drag values in case of airfoil only measurements
Flow Separation
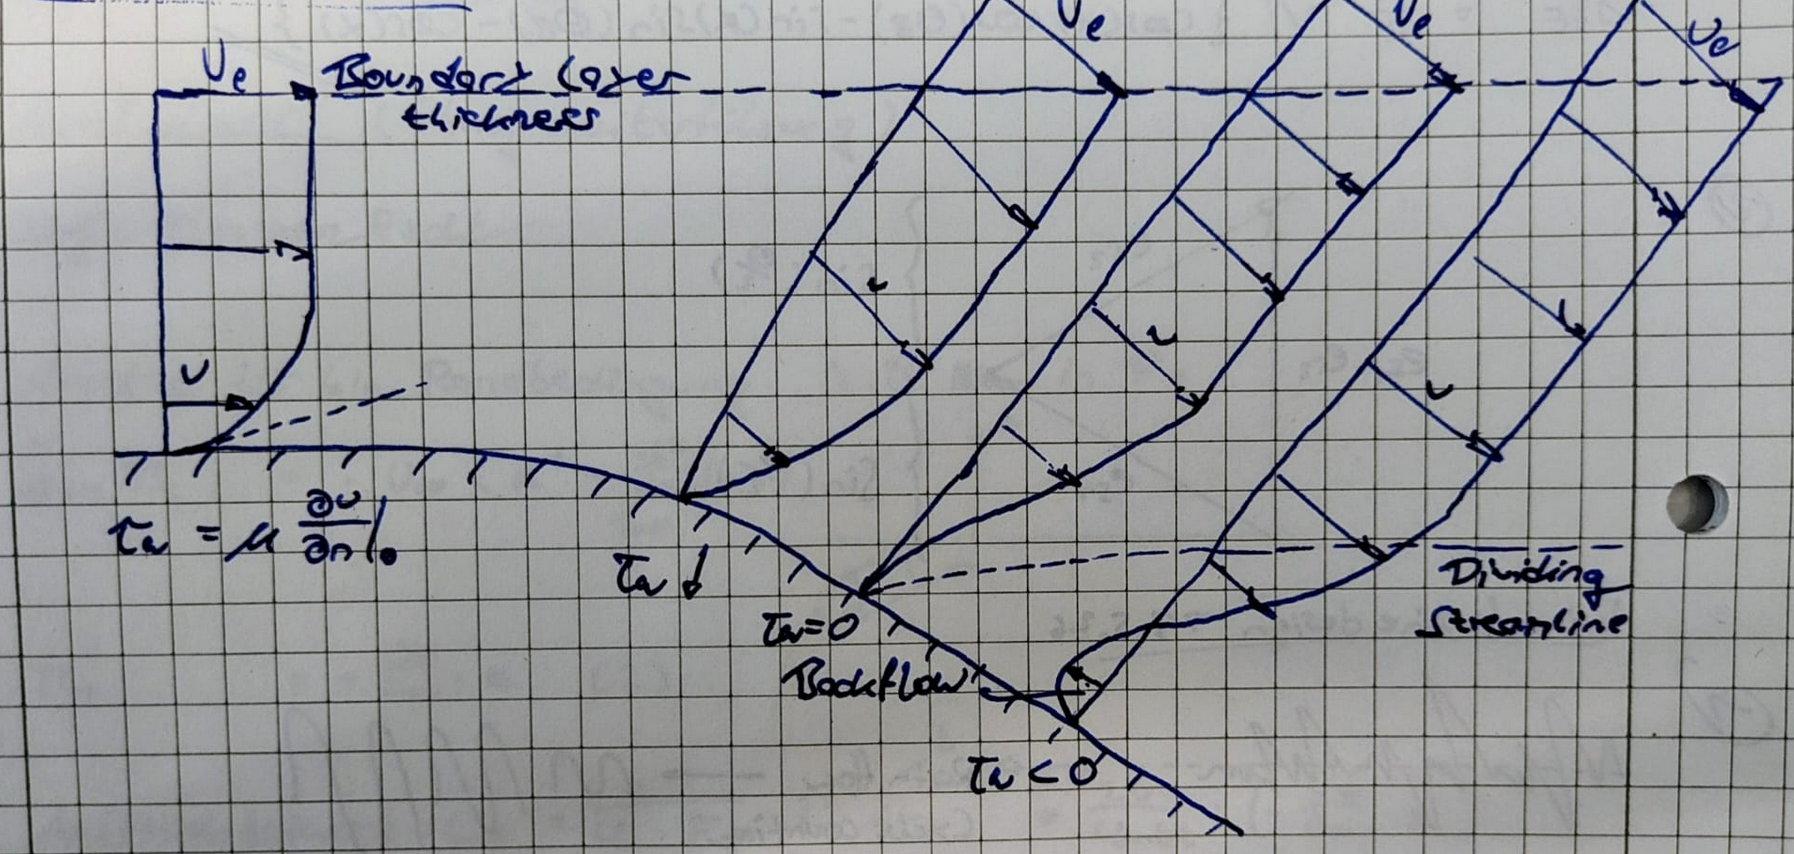
Trailing edge separation
- Adverse pressure gradient starts downstream of the point of maximum thickness (or further upstream when increasing Angle of Attack or AoA)
- Shallow flow separation starts from the TE, moght stay localized over AoA range depending on airfoil
- With increasing AoA, separation moves forward towards the point of maximum thickness and recirculation becomes thicker
- On thick airfoils, separation typically sets in already at relatively low angles of attack, particulatly in tripped / fully turbulent conditions
Leading Edge separation
- Progressive upstream extension of TE separation, separation line jumps forwarf from the point of maximum thickness to the LE, the larger the LE thickness, the higher the AoA for LE separation
- Thin airfoils have small LE radii - high streamline curvature at the LE
- Wind turbine airfoils are typically more prone to negative LE stall - it can occur in standstill or in storm control operation
Stall cells
- Non-uniform separation lines observed in wind tunnel experiments and simulations (Diagram on Slide 4)
- Shape depends on: Airfoil shape, aspect ratio of the wing, reynolds number, AoA
Transition mechanisms on wind turbine blades
Laminar Boundary layer (Diagram on Slide 1)
- ordered flow in almost wall-parallel layers
- almost no wall-normal momentum exchange
- small wall shear stress
- small drag
Turbulent boundary layer (Diagram on Slide 1)
- chaotic motion
- eddies of different sizes and orientation
- significant wall-normal momentum exchange
- large wall shear stress
- large drag
Cross-flow in the inner blade region may lead to cross-flow transition
Quasi 2D flow in the outer blade:
- Natural transition when the blades are clean (Slide 2 onwards)
- Laminar separation bubbles at low Reynolds numbers (Slide 5 onwards)
- Bypass transition in case of dirty or eroded blades (Slide 7)
Aerodynamic polars
- Lift polar: $C_l$ vs $\alpha$
- zero lift angle, at which the airfoil creates no lift
- $C_{l, max}$ is the maximum lift before stall
- soft stall: separation moves gradually towards the LE when increasing the AoA
- hard stall: turbulent separation jumpes quickly to the LE then increasing the AoA
- Drag polar: $C_d$ vs $\alpha$
- laminar drag bucket shows particularly small drag values, de to a significant portion of laminar flow
- at zero lift, drag is at a minimum, as pressure drag is at a minimum there
- outside the laminar bucket and in stalled regimes, pressure drag strongly increases // Diagram on Slide 1
- Moment polar: $C_m$ vs $\alpha$
- reference point is $c/4$
- negative $C_m$ value means airplane nose is pointing down
- in the linear regime, $C_m \propto \alpha$
- in stall, $C_m$ increases because more lift is generated in the rear of the airfoil